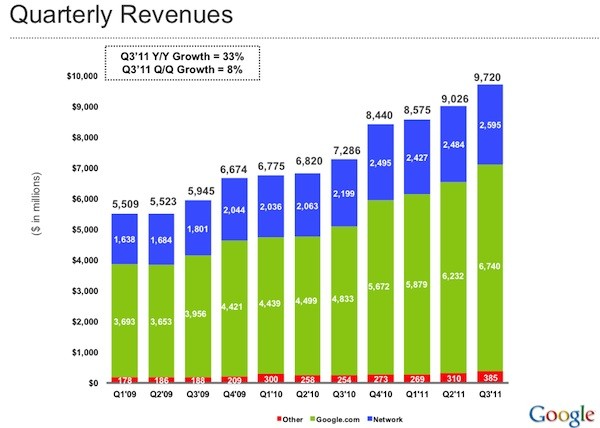
Google’s 2011 third quarter earnings results are in and the company is reporting $9.72 billion in revenue, which is a 33 percent increase from the same quarter last year. GAAP net income came in at $2.73 billion, up from $2.17 billion a year ago and Google-owned sites continued to generate the largest chunk of revenue with $6.74 billion, followed by Google’s partner sites revenues, such as through the AdSense program of $2.6 billion. During the company’s earnings call, CEO Larry Page confirmed that there’s now 190 million Android phones activated around the world and 200 million users of the Chrome web browser…………………
Google Inc. announced financial results for the quarter ended September 30, 2011. “We had a great quarter,” said Larry Page, CEO of Google. “Revenue was up 33% year on year and our quarterly revenue was just short of $10 billion. Google+ is now open to everyone and we just passed the 40 million user mark. People are flocking into Google+ at an incredible rate and we are just getting started!” Google reported revenues of $9.72 billion for the quarter ended September 30, 2011, an increase of 33% compared to the third quarter of 2010. Google reports its revenues, consistent with GAAP, on a gross basis without deducting traffic acquisition costs (TAC). In the third quarter of 2011, TAC totaled $2.21 billion, or 24% of advertising revenues. Google reports operating income, operating margin, net income, and earnings per share (EPS) on a GAAP and non-GAAP basis. The non-GAAP measures, as well as free cash flow, an alternative non-GAAP measure of liquidity, are described below and are reconciled to the corresponding GAAP measures at the end of this release. GAAP operating income in the third quarter of 2011 was $3.06 billion, or 31% of revenues. This compares to GAAP operating income of $2.55 billion, or 35% of revenues, in the third quarter of 2010. Non-GAAP operating income in the third quarter of 2011 was $3.63 billion, or 37% of revenues. This compares to non-GAAP operating income of $2.93 billion, or 40% of revenues, in the third quarter of 2010. GAAP net income in the third quarter of 2011 was $2.73 billion, compared to $2.17 billion in the third quarter of 2010. Non-GAAP net income in the third quarter of 2011 was $3.18 billion, compared to $2.46 billion in the third quarter of 2010. GAAP EPS in the third quarter of 2011 was $8.33 on 327 million diluted shares outstanding, compared to $6.72 in the third quarter of 2010 on 322 million diluted shares outstanding. Non-GAAP EPS in the third quarter of 2011 was $9.72, compared to $7.64 in the third quarter of 2010. Non-GAAP operating income and non-GAAP operating margin exclude the expenses related to stock-based compensation (SBC). Non-GAAP net income and non-GAAP EPS exclude the expenses related to SBC and the related tax benefits. In the third quarter of 2011, the charge related to SBC was $571 million, compared to $380 million in the third quarter of 2010. The tax benefit related to SBC was $116 million in the third quarter of 2011 and $85 million in the third quarter of 2010. Reconciliations of non-GAAP measures to GAAP operating income, operating margin, net income, and EPS are included at the end of this release.
Google reported revenues of $9.72 billion in the third quarter of 2011, representing a 33% increase over third quarter 2010 revenues of $7.29 billion. Google reports its revenues, consistent with GAAP, on a gross basis without deducting TAC. Google-owned sites generated revenues of $6.74 billion, or 69% of total revenues, in the third quarter of 2011. This represents a 39% increase over third quarter 2010 revenues of $4.83 billion. Google‘s partner sites generated revenues, through AdSense programs, of $2.60 billion, or 27% of total revenues, in the third quarter of 2011. This represents a 18% increase from third quarter 2010 network revenues of $2.20 billion. Revenues from outside of the United States totaled $5.3 billion, representing 55% of total revenues in the third quarter of 2011, compared to 54% in the second quarter of 2011 and 52% in the third quarter of 2010. Excluding gains related to our foreign exchange risk management program, had foreign exchange rates remained constant from the second quarter of 2011 through the third quarter of 2011, our revenues in the third quarter of 2011 would have been $53 million lower. Excluding gains related to our foreign exchange risk management program, had foreign exchange rates remained constant from the third quarter of 2010 through the third quarter of 2011, our revenues in the third quarter of 2011 would have been $483 million lower. Revenues from the United Kingdom totaled $1.05 billion, representing 11% of revenues in the third quarter of 2011, compared to 12% in the third quarter of 2010. Aggregate paid clicks, which include clicks related to ads served on Google sites and the sites of our AdSense partners, increased approximately 28% over the third quarter of 2010 and increased approximately 13% over the second quarter of 2011. Average cost-per-click, which includes clicks related to ads served on Google sites and the sites of our AdSense partners, increased approximately 5% over the third quarter of 2010 and decreased approximately 5% over the second quarter of 2011.
Traffic acquisition costs, the portion of revenues shared with Google‘s partners, increased to $2.21 billion in the third quarter of 2011, compared to TAC of $1.81 billion in the third quarter of 2010. TAC as a percentage of advertising revenues was 24% in the third quarter of 2011, compared to 26% in the third quarter of 2010. The majority of TAC is related to amounts ultimately paid to our AdSense partners, which totaled $1.83 billion in the third quarter of 2011. TAC also includes amounts ultimately paid to certain distribution partners and others who direct traffic to our website, which totaled $383 million in the third quarter of 2011. Other cost of revenues, which is comprised primarily of data center operational expenses, amortization of intangible assets, content acquisition costs as well as credit card processing charges, increased to $1.17 billion, or 12% of revenues, in the third quarter of 2011, compared to $747 million, or 10% of revenues, in the third quarter of 2010 Operating expenses, other than cost of revenues, were $3.28 billion in the third quarter of 2011, or 34% of revenues, compared to $2.19 billion in the third quarter of 2010, or 30% of revenues. Stock-Based Compensation (SBC) – In the third quarter of 2011, the total charge related to SBC was $571 million, compared to $380 million in the third quarter of 2010. GAAP operating income in the third quarter of 2011 was $3.06 billion, or 31% of revenues. This compares to GAAP operating income of $2.55 billion, or 35% of revenues, in the third quarter of 2010. Non-GAAP operating income in the third quarter of 2011 was $3.63 billion, or 37% of revenues. This compares to non-GAAP operating income of $2.93 billion, or 40% of revenues, in the third quarter of 2010. Interest and other income, net increased to $302 million in the third quarter of 2011, compared to $167 million in the third quarter of 2010. GAAP net income in the third quarter of 2011 was $2.73 billion, compared to $2.17 billion in the third quarter of 2010. Non-GAAP net income was $3.18 billion in the third quarter of 2011, compared to $2.46 billion in the third quarter of 2010. GAAP EPS in the third quarter of 2011 was $8.33 on 327 million diluted shares outstanding, compared to $6.72 in the third quarter of 2010 on 322 million diluted shares outstanding. Non-GAAP EPS in the third quarter of 2011 was $9.72, compared to $7.64 in the third quarter of 2010. Net cash provided by operating activities in the third quarter of 2011 totaled $3.95 billion, compared to $2.89 billion in the third quarter of 2010. In the third quarter of 2011, capital expenditures were $680 million, the majority of which was related to IT infrastructure investments, including data centers, servers, and networking equipment. Free cash flow, an alternative non-GAAP measure of liquidity, is defined as net cash provided by operating activities less capital expenditures. In the third quarter of 2011, free cash flow was $3.27 billion.
Among the key numbers to note:
- Research and development spending was $1.4 billion in the third quarter, or 14 percent of revenue. Sales and marketing expenses were 11 percent of revenue.
- Operating income in the third quarter was $3.06 billion, up from $2.55 billion in the same quarter a year ago.
- Google’s network revenue—AdSense—was $2.6 billion, up 18 percent from a year ago. Google’s revenue breakdown includes traffic acquisition costs.
- International revenue was $5.3 billion, or 55 percent of the total revenue pie. In the international unit, United Kingdom revenue was 11 percent of sales.
- Cost per click increased 5 percent in the third quarter from a year ago, but fell 5 percent sequentially. Paid clicks were up 28 percent in the third quarter compared to a year ago.
- Other cost of revenue—data centers, content acquisition and credit card processing among other items—was $1.17 billion in the third quarter, up from $747 million a year ago.
- Google ended the quarter with 31,353 employees, up from 28,768 three months earlier.
- Google had $13.63 billion in cash and cash equivalents and another $21.3 billion in marketable securities.
Investors pushed Google higher in afterhours trading.

[ttjad keyword=”general”]