A home-brewed graphing calculator called Open SciCal promises to put a powerful machine built entirely from open-source hardware into the pockets of quant jocks and statisticians.DIYer constructs 4.3-inch Open SciCal graphing calculator, puts your TI-83+ to shame…
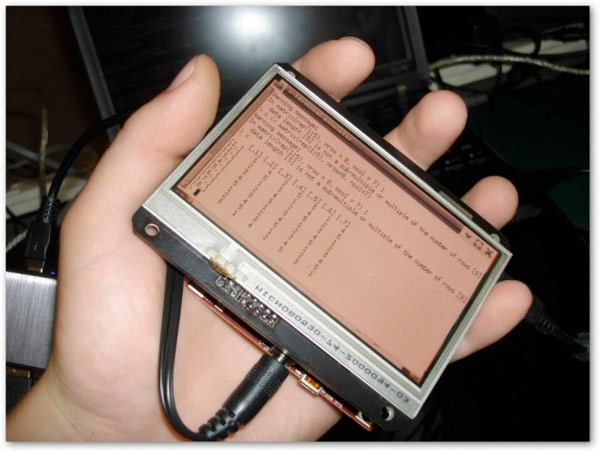
What’s 4.3-inches diagonally, costs $200 to build and has absolutely no reception issues when held as shown in the image above? Why, the Open SciCal! Matt Stack, the genius who pieced this gem together, relied on a 1GHz ARM Cortex A8 CPU, 8GB SD card, WiFi module and a spartan web browser in order to concoct what’s likely the most desirable graphing calculator this side of Pluto. The handheld device weighs about 1.6 pounds, runs Linux as well as the statistically inclined R, and is reportedly capable of doing roughly twice as much crunching as Texas Instruments’ Nspire. Skeptical?
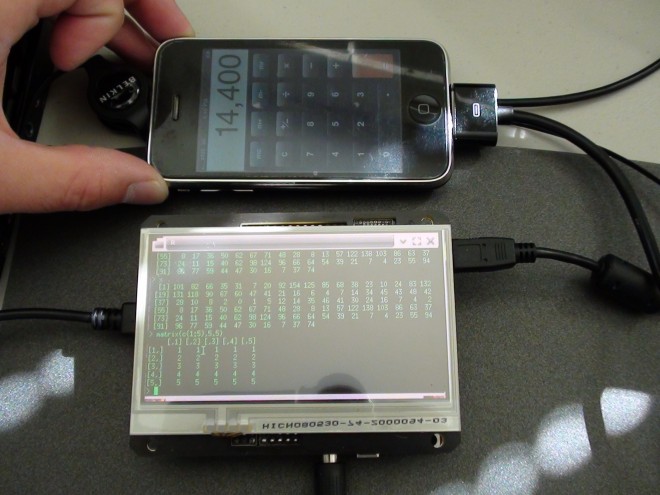
Open SciCal has a 4.3-inch color touchscreen and is just a little bigger than an iPhone. The device uses a BeagleBoard, a low-power, single-board computer that’s based on the same 1-GHz ARM Cortex A8 processor that drives most sophisticated smartphones today. It also has a 8-GB SD card, Wi-Fi capability and can run a web browser.A graphing calculator can take data sets and plot graphs in addition to running scientific functions on it.
Many graphing calculators allow users to attach sensors to them so they can log data directly into the device. But as data sets increase in size and complexity, they are outgrowing traditional graphing calculators available from companies such as HP and Texas Instruments. Add to that restrictions on the kind of external sensors that can be attached and it makes a device built on open-source components an attractive alternative, says Stack.
To test Open SciCal, Stack used existing data to predict sunspots and understand the statistical significance of a recent solar storm.Another task for the Open SciCal: Pull stock data from sites like Yahoo Finance and run auto-correlation on the data to discern trends in the stock.
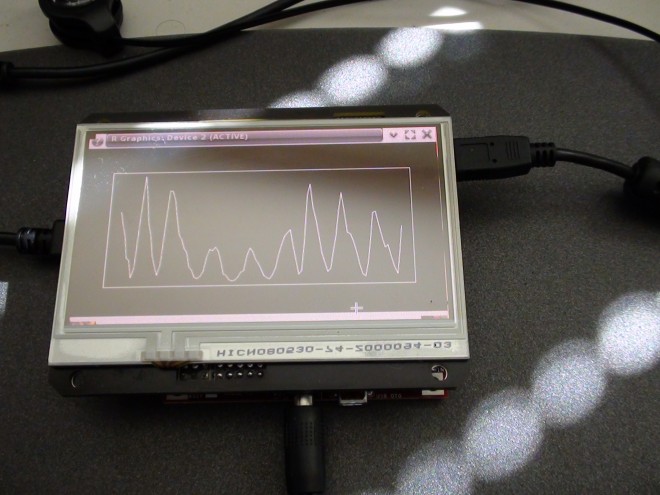
Considering that this bad boy sucked down stock data from Yahoo! Finance and ran auto-correlation on the numbers in order to near-instantly report current trends, we’re guessing TI (or any other graphing calculator company, really) has no room to argue. Hit the source for more details, and don’t worry that feeling of insignificance wanes with time.
Resources :wired.com,engadget.com

Cool, but software graphers rocks. Look at graph-calc.com or http://www.pomapps.com/mycalculator/ – looks amazing!
New leaked photos! justin bieber and selena gomez kissing in bed! Look hare , http://www.cledit.com