T-Mobile loses 150,000 customers this year and still working through its deal to merge with AT&T, the mobile network lost 50,000 customers in this second quarter alone. According to the report the carrier lost a total of 50,000 customers last quarter, which is actually an encouraging sign, considering it dropped a whopping 99,000 during Q1 and 93,000 during the second quarter of 2010. T-Mobile partly made it up in sales of pre-paid sales, as the pre-paid customer segment is rising in the company’s portfolio and AT&T is still pushing ahead with the acquisition of T-Mobile USA………….
News Highlights:
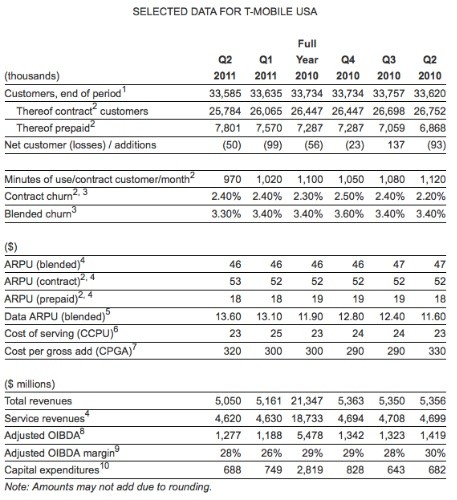
- Adjusted OIBDA of $1.3 billion in the second quarter of 2011, up from $1.2 billion in the first quarter of 2011 but down from $1.4 billion in the second quarter of 2010
- Service revenues in the second quarter of 2011 of $4.6 billion, consistent with the first quarter of 2011, but down 1.7% from $4.7 billion in the second quarter of 2010
- Contract ARPU of $53 in the second quarter of 2011, up from $52 in the first quarter of 2011 and each of the previous four quarters
- Data ARPU of $13.60 in the second quarter of 2011, up $2.00 or 17.2% from the second quarter of 2010Net customer losses of 50,000, an improvement from 99,000 net customer losses in the first quarter of 2011 and 93,000 net customer losses in the second quarter of 2010
- Nearly 10 million customers using 3G/4G smartphones as of the second quarter of 2011, an increase of 50% from the second quarter of 2010
- America’s Largest 4G Network currently covers over 200 million people in over 190 markets and is being upgraded to even faster speeds (HSPA+ 42), which now covers more than 170 million people in over 100 markets
T-Mobile USA Inc. reported second quarter 2011 results. For the second quarter of 2011, T-Mobile USA reported service revenues of $4.6 billion, consistent with service revenues in the first quarter of 2011 and adjusted OIBDA of $1.3 billion, up from $1.2 billion reported in the first quarter of 2011. The number of Americans covered by their 4G network and the number of our customers using 3G/4G smartphones both continued to increase significantly during the quarter, driving growth in data ARPU. Additionally, net customer losses were 50,000 in the second quarter of 2011, nearly a 50% improvement from the 99,000 net customer losses in the first quarter of 2011. “In a challenging market, we are seeing some encouraging trends in the quarter, particularly with our prepaid product growth and our year-on-year contract ARPU increase, thanks to all-time high of 29% of our customer base using 3G/4G smartphones. While contract churn continues to be high, we are focused on upgrading our customers to higher quality products and concentrating on retaining our loyal customers,” said Philipp Humm, President and CEO of T-Mobile USA. “We also continue to focus on customer value through further network upgrades where we now reach more than 170 million Americans with even faster speeds, through our large 4G Android device portfolio, and by offering affordable unlimited rate plans.” “The United States remains a difficult market for Deutsche Telekom, but we see improvements compared to the first quarter of 2011. T-Mobile USA will continue its strategy with the extended HSPA+ 42 coverage and continued data growth,” said René Obermann, CEO of Deutsche Telekom.
T-Mobile USA served 33.6 million customers at the end of the second quarter of 2011, generally consistent with the first quarter of 2011 and the second quarter of 2010. In the second quarter of 2011, net customer losses were 50,000, compared to net losses of 99,000 in the first quarter of 2011 and 93,000 in the second quarter of 2010. In the second quarter of 2011, partner branded customers, representing our Wal-Mart Family Mobile business, were reclassified to the contract category from prepaid as the hybrid product, introduced in the third quarter of 2010, has demonstrated product characteristics more closely associated with T-Mobile USA‘s other contract products. Prior quarter amounts have been restated to conform to current period customer reporting classifications. Contract net customer losses were 281,000 in the second quarter of 2011, an improvement of 26% from the 382,000 net contract customer losses in the first quarter of 2011, but a decline from the 106,000 net contract customer additions in the second quarter of 2010. Sequentially, the improvement in net contract customer losses was driven primarily by the introduction of new unlimited rate plans in the second quarter and faster growth in our connected device business.
The decline in contract customers in the second quarter 2011 when compared to the second quarter of 2010 was due to intense competitive pressures in the US wireless marketplace and the implementation of strengthened credit standards as part of T-Mobile USA‘s focus on improving customer quality. Additionally, connected device net customer additions, included within contract customers, were 256,000 in the second quarter of 2011, an improvement of 33% compared to 192,000 in the first quarter of 2011 and 27% compared to 202,000 in the second quarter of 2010. Connected device customers totaled 2.3 million at June 30, 2011. Prepaid net customer additions, including MVNO customers, were 231,000 in the second quarter of 2011, down 18% compared to 283,000 in the first quarter of 2011 and up substantially from the 199,000 net losses in the second quarter of 2010. The sequential decline in prepaid net customer additions was due primarily to fewer FlexPay non-contract gross customer additions which were offset in part by customer growth in traditional prepaid plans. Year-on-year, prepaid net customer additions increased primarily due to the growth in customers including MVNOs, purchasing prepaid monthly unlimited plans. MVNO customers continued to grow in the second quarter of 2011, totaling 3.5 million as of June 30, 2011.
Blended churn, reflecting both contract and prepaid customers, decreased to 3.3% in the second quarter of 2011 from 3.4% in both the first quarter of 2011 and the second quarter of 2010. The sequential and year-on-year decrease in blended churn was primarily driven by lower churn from T-Mobile USA branded customers (excluding MVNO and connected devices). Contract churn was 2.4% in the second quarter of 2011, consistent with the first quarter of 2011 but up from 2.2% in the second quarter of 2010. The year-on-year increase in contract churn was primarily driven by competitive pressures in the US wireless industry which have continued to negatively impact T-Mobile USA‘s contract customer base. Prepaid churn decreased in the second quarter of 2011 to 6.6%, from 6.7% in the first quarter of 2011 and 7.6% in the second quarter of 2010. The sequential decrease in prepaid churn was driven by a shift in the customer base towards traditional prepaid products, which was partially offset by higher MVNO churn. Year-on-year, prepaid churn decreased due to lower traditional prepaid product churn resulting from the success of T-Mobile USA‘s recently introduced prepaid monthly unlimited plans. T-Mobile USA reported adjusted OIBDA of $1.3 billion in the second quarter of 2011, compared to $1.2 billion in the first quarter of 2011 and $1.4 billion in the second quarter of 2010.
OIBDA was adjusted in the second quarter of 2011, to exclude AT&T transaction-related costs of $13 million, primarily consisting of employee-related expenses. Sequentially, adjusted OIBDA increased due to lower handset subsidies and upgrade expenses in the second quarter of 2011 as compared to the first quarter of 2011, which included more costly customer loyalty initiatives. Year-on-year, second quarter adjusted OIBDA decreased as a result of lower service revenue as described above. Additionally, higher network expenses related to the continued investment in T-Mobile USA’s 4G network were offset in part by lower volume-driven commission expenses and lower expenses resulting from T-Mobile USA‘s Reinvent cost saving initiative program. Adjusted OIBDA margin was 28% in the second quarter of 2011, up from 26% in the first quarter of 2011 but down from 30% in the second quarter of 2010. Net income in the second quarter of 2011 was $212 million, up 57% when compared to $135 million in the first quarter of 2011 and down 48% from the $404 million reported in the second quarter of 2010. Sequentially and year-on-year, the changes in net income were driven by the same factors impacting adjusted OIBDA, as described above. Additionally, certain fair value adjustments related to our financial instruments impacted Other expense, net, contributing to the changes in net income.
Service revenueswere $4.6 billion in the second quarter of 2011, consistent with $4.6 billion in the first quarter of 2011 and down 1.7% from $4.7 billion in the second quarter of 2010. Service revenues in the second quarter of 2011 were positively impacted by data revenue growth, driven by increased adoption of mobile broadband data and unlimited text plans by our customers, seasonally higher roaming revenue and higher prepaid revenues from the growth in monthly unlimited plan adoption. These revenue growth drivers were more than offset by voice revenue declines related to net losses of branded customers, compared to the first quarter of 2011. Year-on-year, quarterly service revenues decreased primarily due to contract customer losses, which were partially offset by the increased adoption of data plans in our contract and prepaid customer base and from T-Mobile USA directly providing handset insurance services to its customers. Total revenues, including service, equipment, and other revenues were $5.1 billion in the second quarter of 2011, down from $5.2 billion in the first quarter of 2011 and $5.4 billion in the second quarter of 2010. Equipment revenues decreased sequentially and year-on-year due primarily to lower handset sales volumes.
Blended Average Revenue Per User (“ARPU” as defined in Note 4 to the Selected Data, below) was $46 in the second quarter of 2011, consistent with the first quarter of 2011, but lower than $47 in the second quarter of 2010 driven by a shift in the customer base towards prepaid plans. Contract ARPU was $53 in the second quarter of 2011, up from $52 in the first quarter of 2011 and each of the previous four quarters. Sequentially and year-on-year, contract ARPU increased as data revenue growth more than offset lower voice revenue. In addition, the year-on-year increase benefitted from handset insurance contract revenues due to the launch of the directly-provided T-Mobile Personal Handset Protection insurance and warranty program in the fourth quarter of 2010. Prepaid ARPU was $18 in the second quarter of 2011, consistent with both the first quarter of 2011 and second quarter of 2010. Data service revenues (as defined in Note 4 to the Selected Data, below) were $1.4 billion in the second quarter of 2011, up 17% from the second quarter of 2010. Data service revenues in the second quarter of 2011 represented 30% of blended ARPU, or $13.60 per customer, up from 29% of blended ARPU, or $13.10 per customer in the first quarter of 2011, and 25% of blended ARPU, or $11.60 per customer in the second quarter of 2010. In the second quarter of 2011, the increase in the number of customers using smartphones and the continued upgrade of the 3G and 4G networks drove Internet access revenue growth through the increasing adoption of mobile broadband data plans.
9.8 million customers were using smartphones enabled for the T-Mobile USA 3G/4G network such as the T-Mobile myTouch 4G, T-Mobile G2x with Google and the Samsung Galaxy S 4G at the end of the second quarter of 2011. This represents a net increase of 50% or nearly 3.3 million customers using smartphones from the second quarter of 2010. 3G/4G smartphone customers now account for 29% of total customers, up from 27% in the first quarter of 2011 and 19% in the second quarter of 2010. Messaging revenue also increased sequentially in the second quarter of 2011 with customers moving towards unlimited plans including messaging. Messaging accounted for approximately 35% of total data revenues, compared to 37% in the second quarter of 2010. The average cost of acquiring a customer, Cost Per Gross Add was $320 in the second quarter of 2011, up from $300 in the first quarter of 2011, but down from $330 in the second quarter of 2010.
Sequentially, CPGA increased in the second quarter of 2011 primarily due to higher handset subsidies as T-Mobile USA offered a variety of incentives to attract customers. Compared to the second quarter of 2010, CPGA decreased primarily due to lower commission expenses and a shift in the mix of customer additions towards MVNO and connected device customers. The average cash cost of serving customers, Cash Cost Per User was $23 per customer per month in the second quarter of 2011, down from $25 in the first quarter of 2011 and consistent with the second quarter of 2010. CCPU decreased in the second quarter of 2011 compared to the first quarter of 2011 due to lower equipment subsidies from customer loyalty initiatives than were offered in the first quarter of 2011. Cash capital expenditures were $688 million in the second quarter of 2011, compared to $749 million in the first quarter of 2011 and $682 million in the second quarter of 2010. Sequentially, the decrease in cash capital expenditures was a result of payment timing differences which were partially offset by an increase in incurred capital expenditures during the quarter. In the second quarter of 2011, incurred capital expenditures were the result of the continued build-out of the HSPA+ 21 and HSPA+ 42 networks.
Compared to the second quarter of 2010, cash capital expenditures were consistent and continued to be incurred to allow for network coverage expansion and the upgrade to HSPA+ 42. T-Mobile USA currently offers its customers America’s Largest 4G Network with HSPA+ 21 service available in over 190 markets reaching over 200 million people. To further improve the value provided to customers through its 4G mobile broadband network, T-Mobile USA has continued to invest in its HSPA+ 42 network, which reached over 170 million people as of the end of the second quarter of 2011, doubling the theoretical speed of its 4G network to 42 Mbps. On March 20, 2011, Deutsche Telekom AG and AT&T Inc. entered into a definitive agreement under which AT&T will acquire T-Mobile USA from Deutsche Telekom in a cash and stock transaction valued at approximately $39 billion, subject to adjustment in accordance with the agreement. The agreement has been approved by the Board of Directors of both companies, and is expected to provide an optimal combination of network assets to add capacity and provide an opportunity to improve network quality in the near term for the customers of both companies. In particular, the transaction is important to address spectrum constraints and gives T-Mobile USA customers a clear path to take advantage of new generation LTE (Long Term Evolution) services. The transaction is expected to close in the first half of 2012, subject to regulatory approvals and other closing conditions. As part of the transaction, Deutsche Telekom will receive an equity stake in AT&T that, based on the terms of the agreement, would give Deutsche Telekom an ownership interest in AT&T of approximately 8 percent and one seat on the AT&T Board of Directors.
During the second quarter of 2011, and again in July 2011, T-Mobile USA introduced a series of new Value rate plans that provide exceptional value and choice to the wireless consumer, reinforcing a focus on making it more affordable for customers to experience America’s Largest 4G Network. These plans include offerings of unlimited talk, text and data services to individuals and families (both with and without handset subsidies). T-Mobile USA continues to unveil leading devices including the HTC Sensation 4G and the myTouch 4G Slide to leverage America’s Largest 4G Network. In August 2011, T-Mobile USA announced a new partnership with 7-Eleven Stores, Inc. to provide a prepaid no contract handset and service through the retail chain’s 7-Eleven stores. T-Mobile USA is the U.S. wireless operation of Deutsche Telekom AG. In order to provide comparability with the results of other US wireless carriers, all financial amounts are in US dollars and are based on accounting principles generally accepted in the United States (“GAAP“). T-Mobile USA results are included in the consolidated results of Deutsche Telekom, but differ from the information contained herein as Deutsche Telekom reports financial results in Euros and in accordance with International Financial Reporting Standards (IFRS).
Sequentially, CPGA increased in the second quarter of 2011 primarily due to higher handset subsidies as T-Mobile USA offered a variety of incentives to attract customers. Compared to the second quarter of 2010, CPGA decreased primarily due to lower commission expenses and a shift in the mix of customer additions towards MVNO and connected device customers. The average cash cost of serving customers, Cash Cost Per User (“CCPU” as defined in Note 6 to the Selected Data, below), was $23 per customer per month in the second quarter of 2011, down from $25 in the first quarter of 2011 and consistent with the second quarter of 2010. CCPU decreased in the second quarter of 2011 compared to the first quarter of 2011 due to lower equipment subsidies from customer loyalty initiatives than were offered in the first quarter of 2011. Cash capital expenditures (as defined in Note 10 to the Selected Data, below) were $688 million in the second quarter of 2011, compared to $749 million in the first quarter of 2011 and $682 million in the second quarter of 2010. Sequentially, the decrease in cash capital expenditures was a result of payment timing differences which were partially offset by an increase in incurred capital expenditures during the quarter. In the second quarter of 2011, incurred capital expenditures were the result of the continued build-out of the HSPA+ 21 and HSPA+ 42 networks.
[ttjad keyword=”general”]